Watchlog CSV Visualizer is a simple to use software that can help users graph, analyse, annotate and create reports using CSV files.
Watchlog CSV Visualizer is unique Windows software for visualising .csv files. The software can analyse any .csv performance data, regardless of its source and format and has been tested on .csv files containing over 25 million data points across multiple channels.
Quick drag & drop data import
At the heart of the software is a drag and drop import feature that allows a user to preview data in the file before importing it in the required format.
Data can be grouped as it is being imported. Grouping data allows you to specify which columns should be shown in the same charts.
Once imported data can be previewed so the relevant columns can be selected to display in charts. Line colours, chart type etc are all selectable.
Multiple options for viewing data graphically
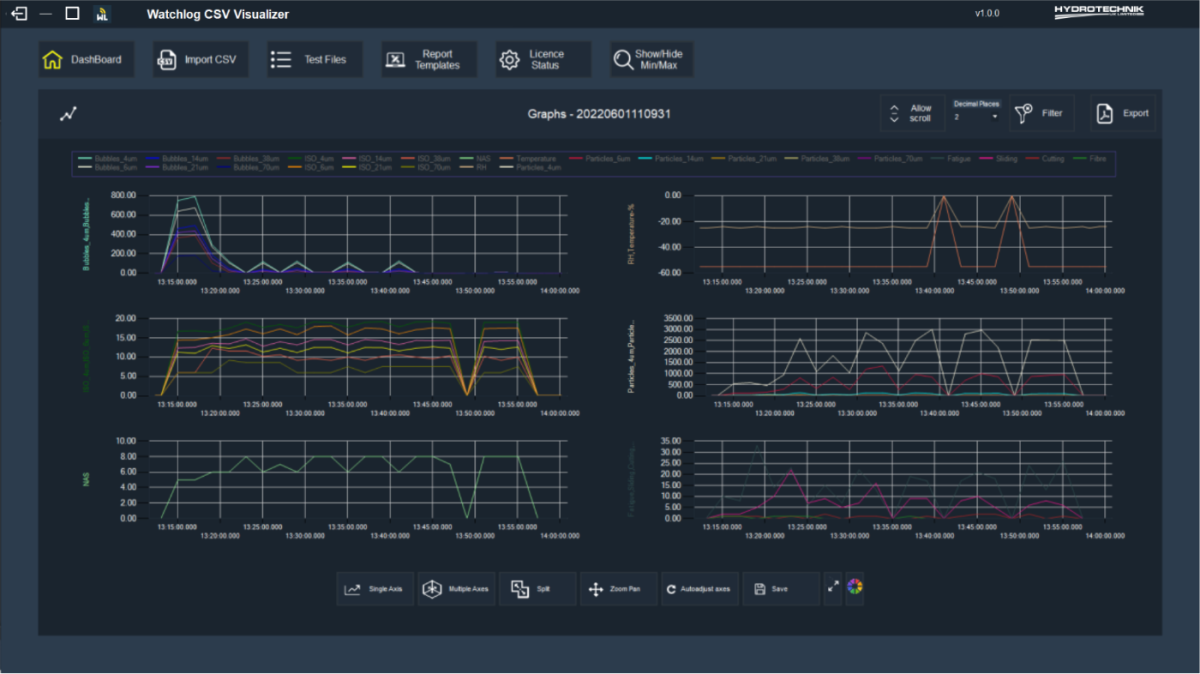
When viewing all graphs on the same screen a user can change the colour of the lines, remove lines and control the colour of the screen background.
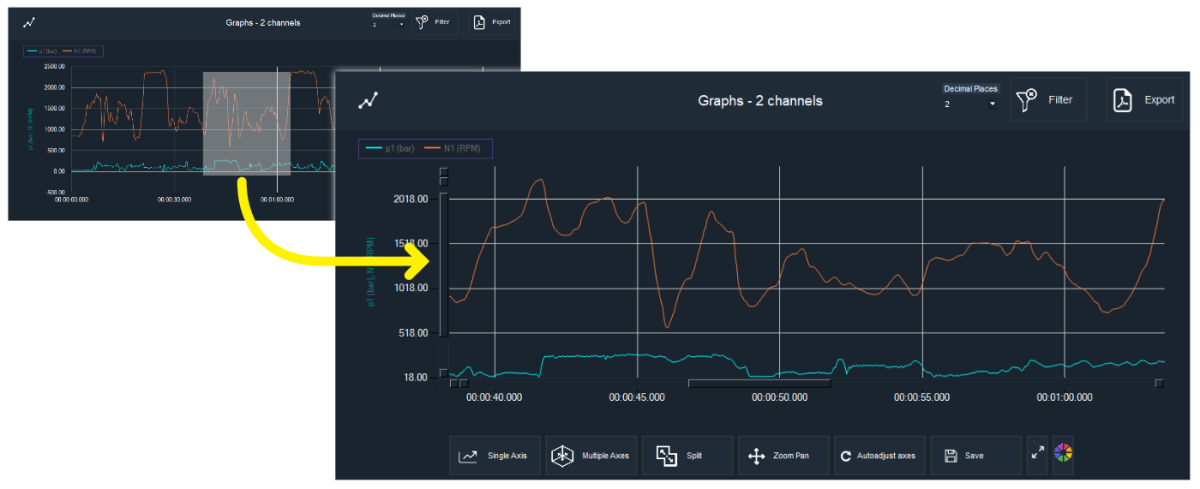
Limitless zoom and pan for finer analysis
Once imported, data is viewed graphically with a simple zooming feature to magnify test data via clicking and dragging over an area, there is no limit the how many times a user can zoom to pinpoint events.
The ability to pan as well as zoom gives you the ability to dig down into the exact data points you are looking for.
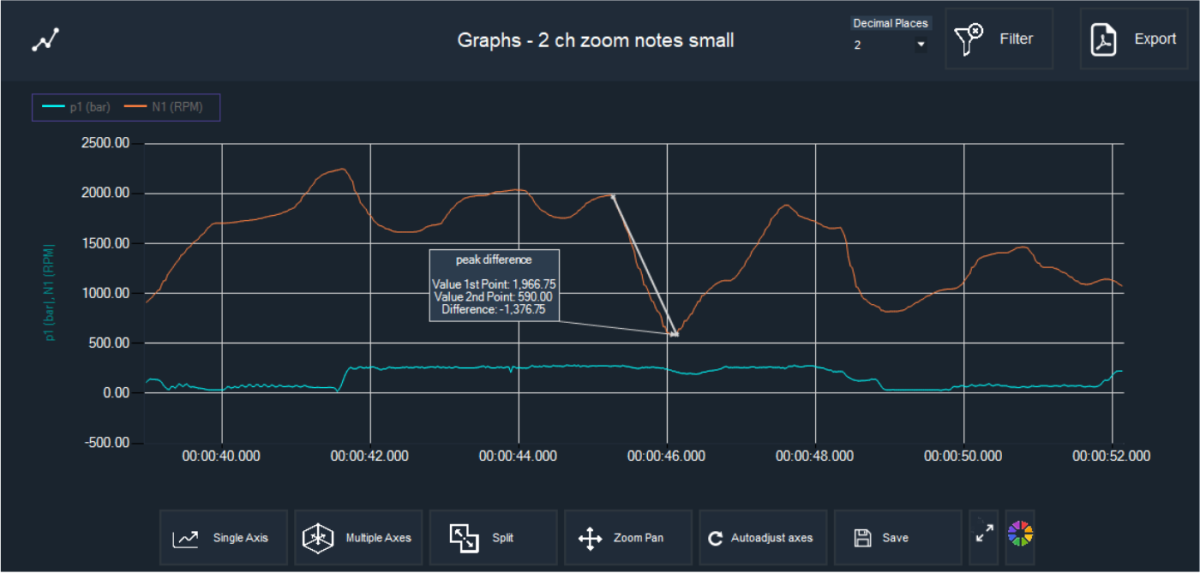
Annotate graphical data
Generate PDF reports and export your
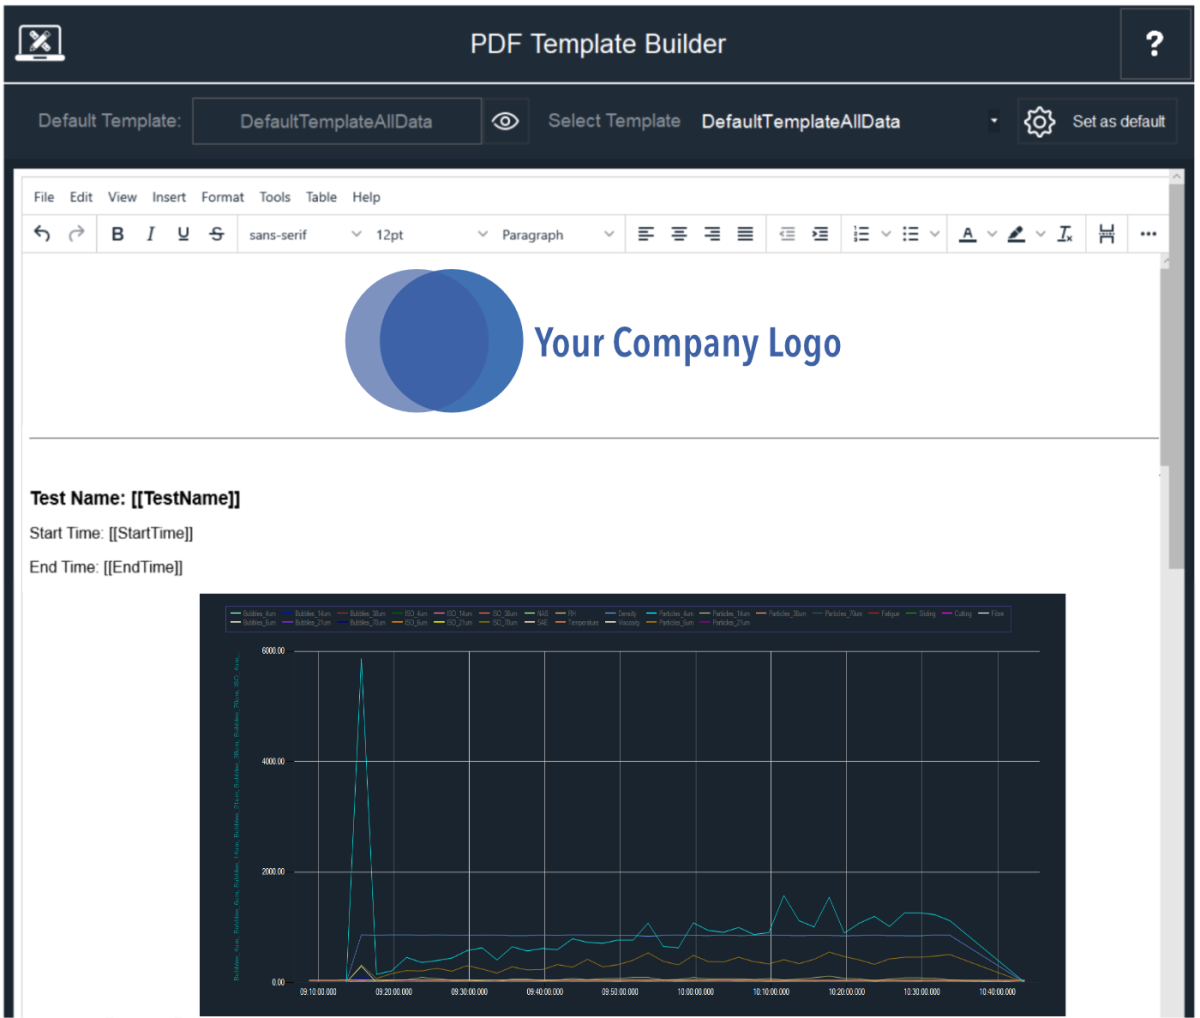
These reports can be customised using your own logo and variables such as [[TestName]] and [[Chart]] give you control over the flow and layout used in your reporting.
Export all or parts of your data
Tests can be manipulated and saved within the software for retrieving later, either save the entire test or just a portion of a test as a more focussed sub-set of the whole test. Saved tests can then be exported as pdfs or can be re-exported as a new .csv file.

Related products
The Bluetooth Datalogging Digital Pressure Gauges are designed for both stationary and mobile measurement and are capable of datalogging as well as display. The USB-C connection allows direct connection to your tablet, or desktop/laptop PC, where the CSV file produced by the gauge can be opened directly into Watchlog CSV Visualizer.
Bluetooth Datalogging Digital Pressure Gauges
Contact Us
- Freephone0800 068 4134
- Phone+44(0)1159 003550
- Emailsales@hydrotechnik.co.uk
Watchlog